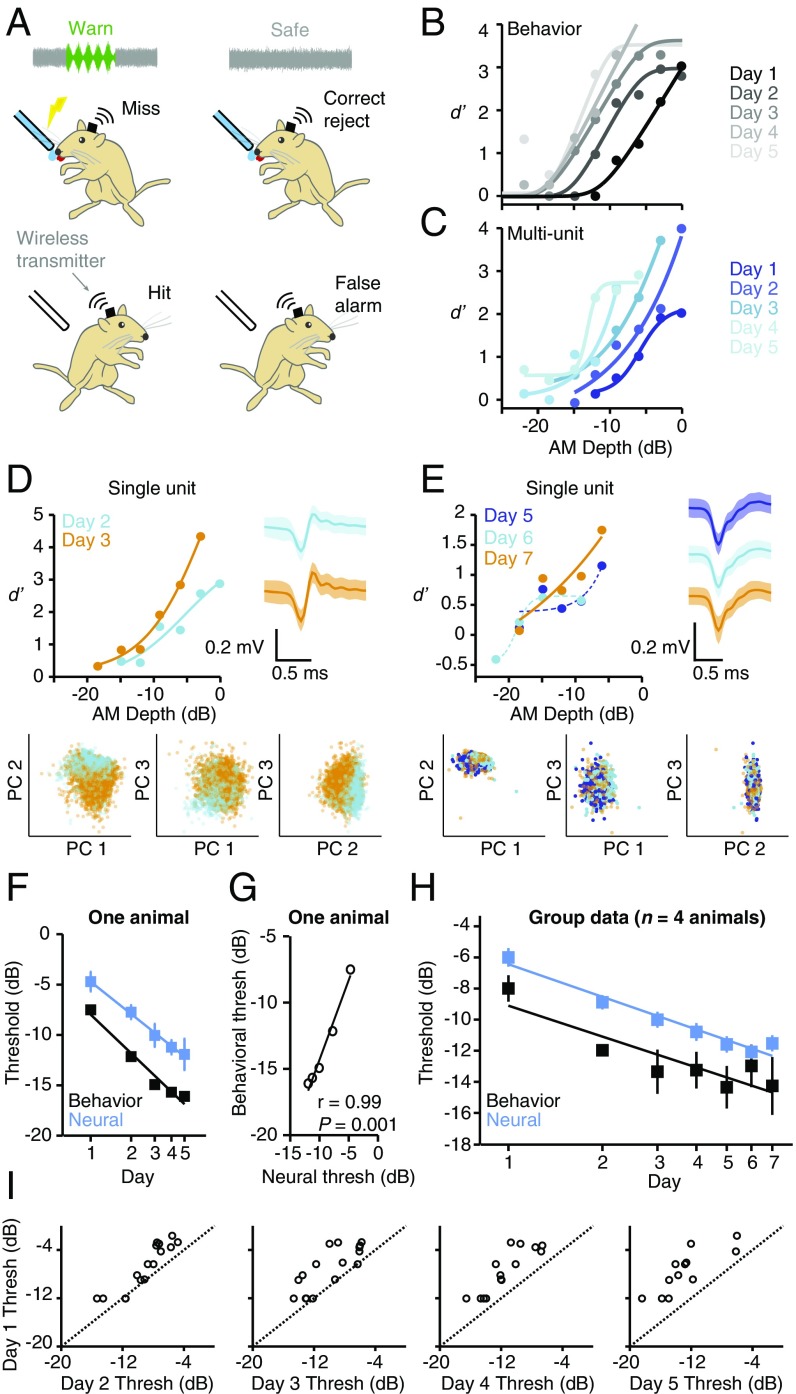
Fig. 1.
Cortical and behavioral improvements are similar in magnitude and time course. (A) Wireless recordings were made from ACx of animals as they performed an AM detection task. (B) Psychometric functions from one animal improved across days. Data from this animal are presented in C–G. (C) Neurometric functions from one multiunit recorded during task performance improved across days. (D) Neurometric performance for a single unit held across multiple sessions improved from day 2 (cyan) to day 3 (orange). Single-unit identity was confirmed by stable waveform shape [compare waveforms from day 2 (cyan) and day 3 (orange); Right]. Waveforms represent mean ± 2 SDs. Single-unit identity was also confirmed by the fact that waveforms from day 2 and day 3 clustered tightly together within principal component (PC) space (Bottom). (E) Data from another single unit held across multiple training sessions. Plot conventions are as in D. Dashed lines indicate fits that did not yield valid thresholds. (F) Mean ± SEM neural and behavioral sensitivity improve simultaneously in one animal (n = 30 sites; 4 to 7 per d). (G) Behavioral and neural thresholds of one animal are tightly correlated. (H) Mean ± SEM neural and behavioral thresholds improve simultaneously across all animals and units [neural: F6,224 = 16, P < 0.0001, n = 231 (range: 29 to 39 sites per d; SI Appendix, Table S1); behavior: F4,12 = 11, P = 0.0005, n = 4 animals]. (I) Day 1 vs. day 2 to 5 thresholds of units recorded over multiple days. See SI Appendix, Table S3 for statistics. The dashed lines are unity.

