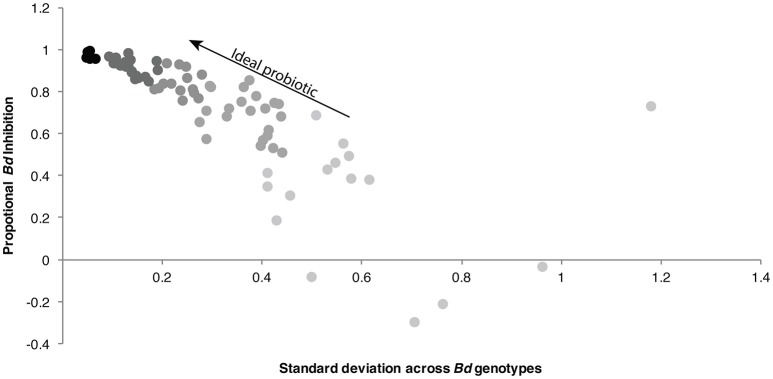
Figure 6.
Selecting bacterial isolates with functional consistency across Bd genotypes. Scatterplot displays mean inhibition vs. standard deviation of inhibition across Bd genotypes. The ideal probiotic candidates will be those with strong inhibitory function and low standard deviation. Points are colored from gray to black to illustrate increasing potential effectiveness as a probiotic.

