Figure 4.
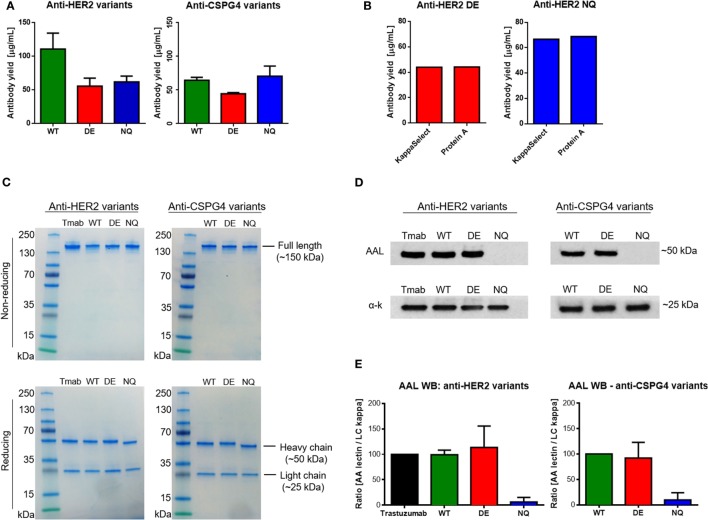
Purified antibody evaluations. (A) Wild–type (WT) and mutant anti-HER2 and anti-CSPG4 antibody yields per mL of cell culture supernatant after purification (data from two independent experiments ± SD). (B) Comparison of anti-HER2 mutant antibody yields after purification using HiTrap Kappa Select (GE Healthcare) or Protein A (Pierce™) columns. (C) Sodium dodecyl sulfate polyacrylamide gel electrophoresis visualization of purified anti-HER2 and anti-chondroitin sulfate proteoglycan (CSPG4) WT and Fc mutant antibodies under non-reducing (top) and reducing (bottom) conditions. PageRuler™ pre-stained protein ladder (Thermo Fischer Scientific) was used as molecular weight reference. Bands were visualized using InstantBlue™ protein stain (Expedeon). (D) Aleuria Aurantia Lectin (AAL) Western blot demonstrating fucosylation patterns of anti-HER2 (top left) and anti-CSPG4 (top right) Fc variants. Anti-human kappa chain antibody was used as a loading control (bottom panels). (E) Quantification of AAL Western blot signal using the ImageJ software. The AAL signal was normalized against the signal obtained with the anti-kappa chain antibody. The ImageJ peak area value of trastuzumab (Herceptin®, Roche) was considered a 100% and the peak area values of the other anti-HER2 variants were presented as a proportion of the first value. The values of anti-CSPG4 DE and NQ were calculated accordingly as a proportion of anti-CSPG4 WT. Data from three independent experiments ± SD.

