Figure 6.
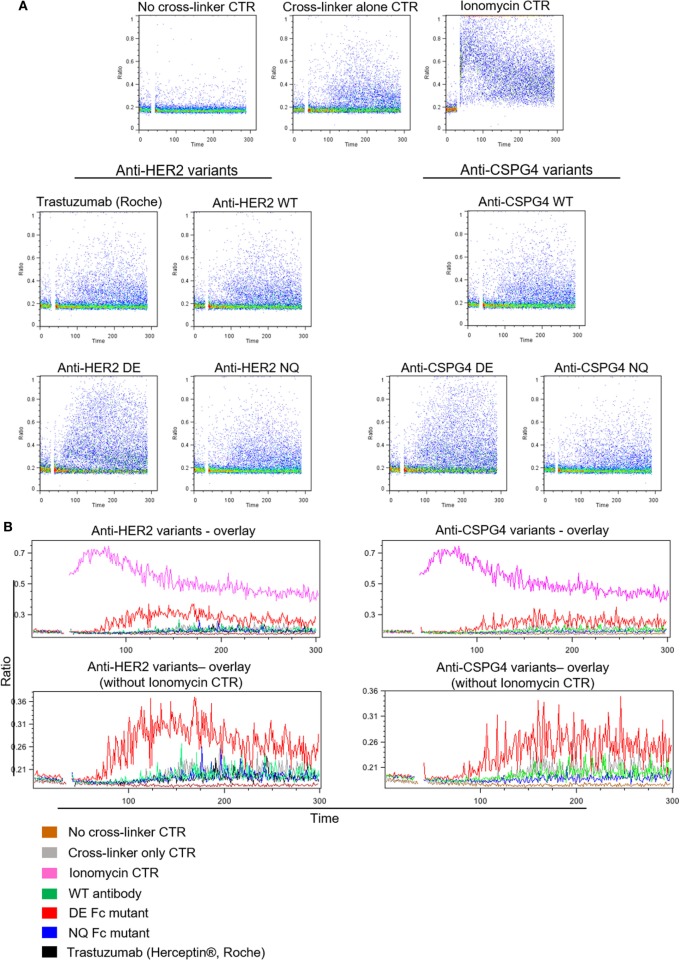
Antibody Fc-mediated calcium mobilization of human NK cells. (A) Flow cytometric dot plot graphs of Ca++ flux assay measurements showing activation of NK cells pre-incubated with different anti-HER2 Fc (left) and anti-chondroitin sulfate proteoglycan 4 (CSPG4) (right) Fc variants after cross-linking with a polyclonal anti-IgG antibody. Ca++ flux into the cells was visualized through the increase in the DAPI/Indo-1 (blue) ratio over time. (B) Histogram overlay demonstrating the differences in Ca++ influx between different anti-HER2 (left) and anti-CSPG4 (right) antibody variants depicted as the changes in the DAPI/Indo-1 Blue fluorescence ratio over time. The top overlays include all antibody variants and controls and the bottom exclude the ionomycin control to more clearly demonstrate the differences between the antibody variants on a smaller scale. Data representative of three independent experiments.

