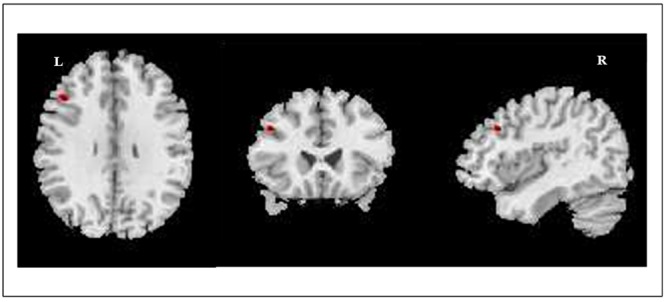
FIGURE 2.

Image illustrates the regions where significant differences in GM densities (peak-level) were observed between BDs and AACs. BDs > AACs. Left middle frontal gyrus, MNI coordinates: –45, 24, 33; K = 315, p < 0.0001. Voxel size: 1.5 mm3.

Image illustrates the regions where significant differences in GM densities (peak-level) were observed between BDs and AACs. BDs > AACs. Left middle frontal gyrus, MNI coordinates: –45, 24, 33; K = 315, p < 0.0001. Voxel size: 1.5 mm3.