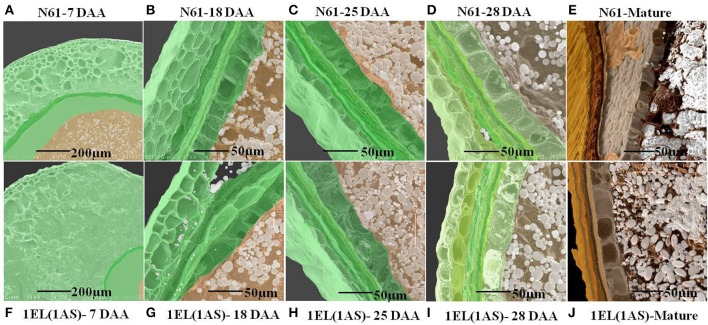
Figure 8.
Scanning electron microscopy of different seed development stages starting from 7 days after anthesis (7 DAA) to 28 DAA of N61 and DTL-1EL(1AS). SEM images indicated that the translocation line showed slow development at 7 DAA as compared to N61. But for the later development stages there was no significant difference observed. (A) N61(7 DAA), (B) N61(18 DAA), (C) N61(25 DAA), (D) N61(28 DAA), (E) N61(mature seeds), (F) 1EL(1AS)(7 DAA), (G) 1EL(1AS) (18 DAA), (H) 1EL(1AS)(25 DAA), (I) 1EL(1AS) (28 DAA), (J) 1EL(1AS) (mature seeds).

