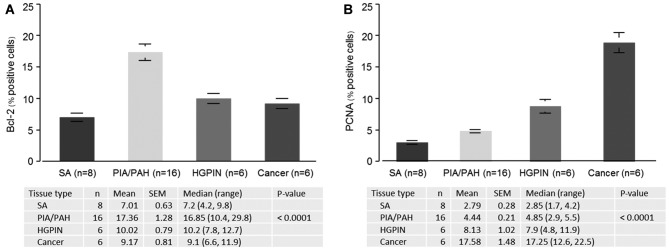
Figure 3.
Distribution of Bcl-2 and PCNA in various morphological lesions. (A) A significant difference in Bcl-2 was noted among the four different tissue types (P<0.0001). The pair-wise comparison showed a significant difference in Bcl-2 expression in SA vs. PIA/PAH lesions (P<0.0001); SA vs. HGPIN (P=0.012); PIA/PAH vs. HGPIN (P=0.002); and PIA/PAH vs. cancer (P=0.0009). (B) A significant difference in PCNA expression was noted among the four different tissue types (P<0.0001). The pair-wise comparison revealed a significant difference in PCNA expression in SA vs. PIA/PAH (P=0.0007); SA vs. HGPIN (P=0.002); SA vs. cancer (P=0.002); PIA/PAH vs. HGPIN (P=0.004); PIA/PAH vs. cancer (P=0.0004); and HGPIN vs. cancer (P=0.004). PCNA, proliferating cell nuclear antigen; SA, simple atrophy; PIA, proliferative inflammatory atrophy; PAH, post-atrophic hyperplasia; HGPIN, high-grade prostatic intraepithelial neoplasia; SEM, standard error of the mean.

