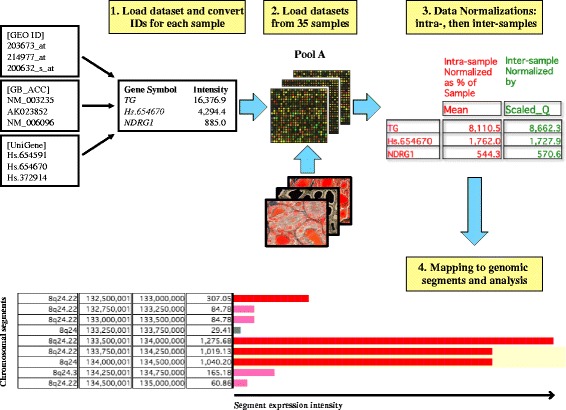
Fig. 1.

Graphic representation of the TRAM software workflow (simplified) for the study of thyroid transcriptome (Pool A). Gene expression datasets obtained by any sample of interest in tab-delimited text format are imported, probe names are assigned to individual loci following conversion of all types of gene identifiers (IDs) into official gene symbols, raw gene expression values are intra-sample normalized as percentage of the sample mean value and inter-sample normalized by scaled quantile. The final reference value for each locus is the mean value of all available normalized values for that locus. The expression is finally also mapped along each chromosome and graphically displayed as expression intensity for each chromosomal segment, expressed as the mean of the expression values of the loci included in that segment. Over- and underexpressed regions are then determined following statistical analysis. If Pools A and B are compared, the values would represent the A/B ratios
