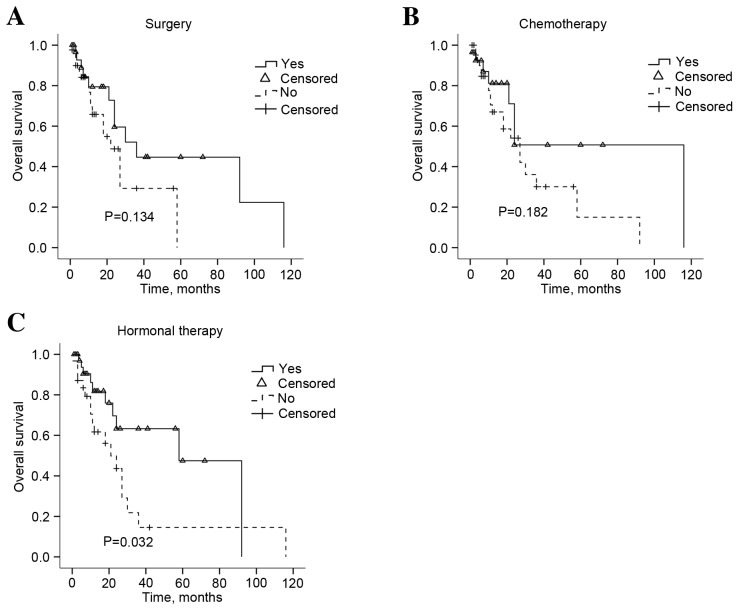
Figure 5.
Overall survival rate in response to the treatment methods administered to patients with gastric metastases. Kaplan-Meier graph for the survival following (A) salvage surgery, (B) salvage chemotherapy and (C) salvage hormonal therapy. Statistical analysis was performed using the log-rank test.

