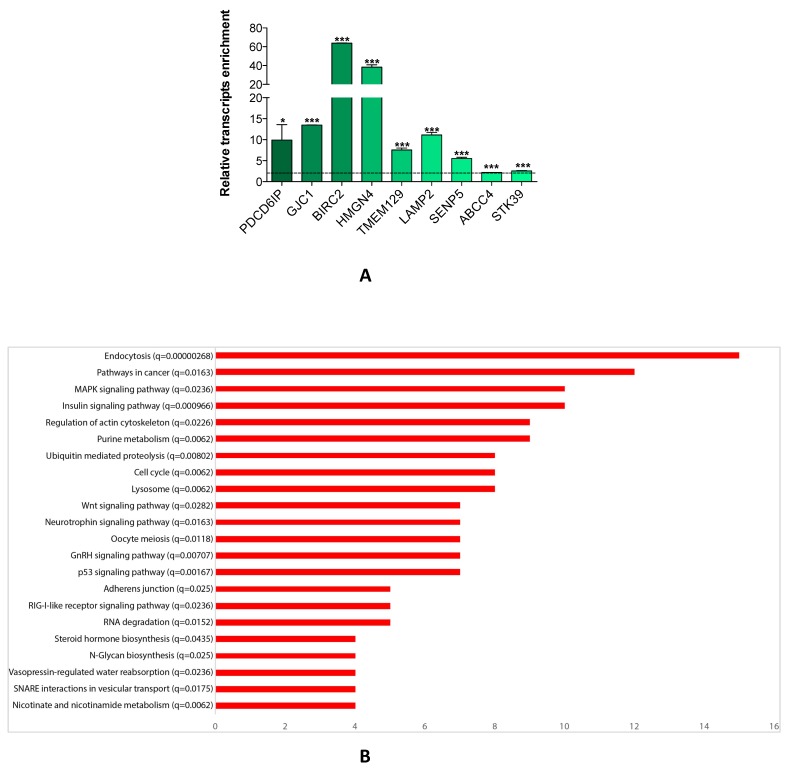
Figure 3.
miR-26a-5p/targetome analysis. (A) Relative quantification with qRT-PCR of selected transcripts of miR-26a-5p/targetome in miR-26a-5p versus control pull out samples. Data are reported as mean of at least three independent experiments (*P<0.05, **P<0.01, ***P<0.001, unpaired t-test). (B) Result of the GSEA tool reporting the most significant KEGG pathways. In the Y axis we report each pathway with the q-value and in the X axis we report the number of genes in each pathway.

