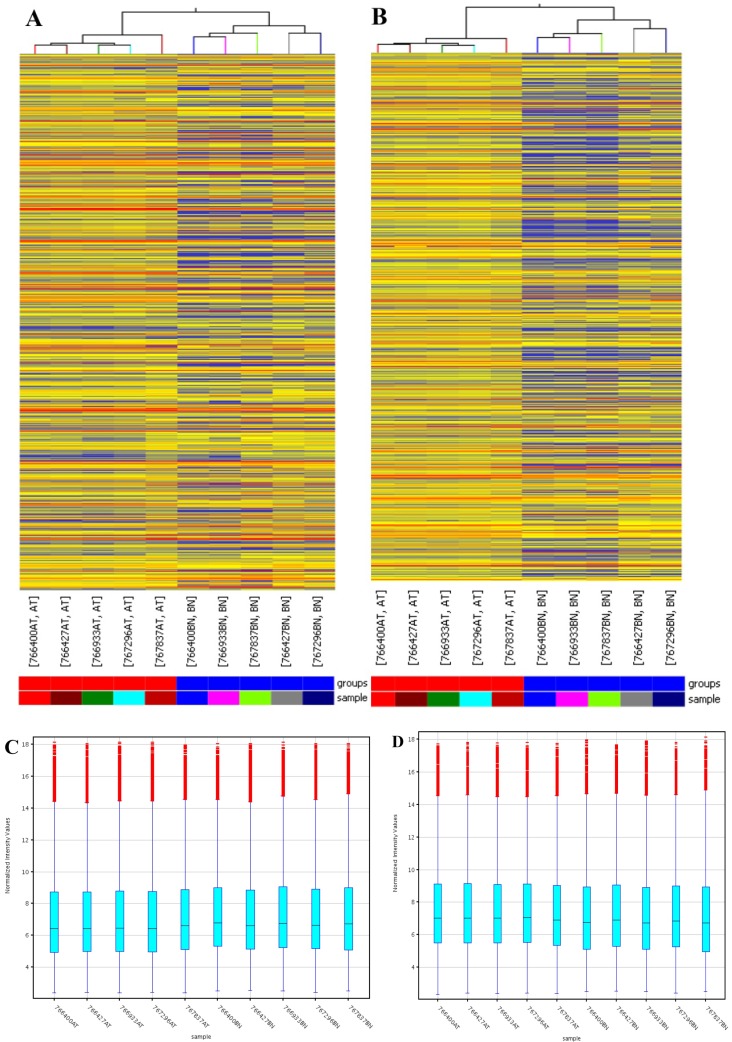
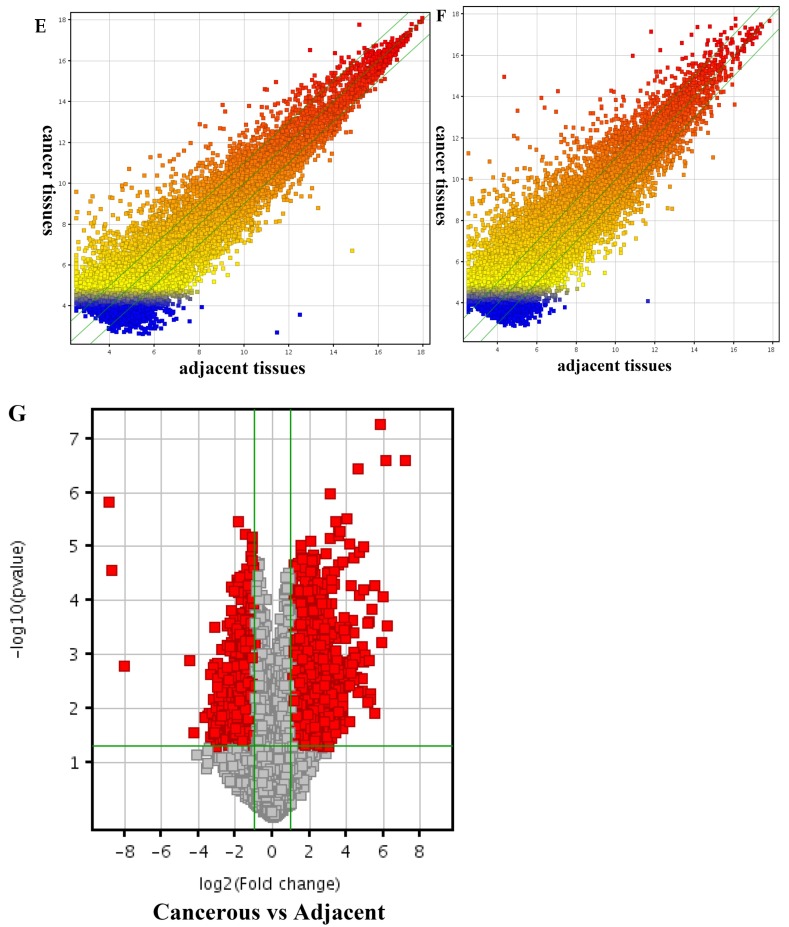
Figure 1.
Differentially expressed lncRNAs and mRNAs in pancreatic adenocarcinoma (PDAC) and adjacent normal tissues. Hierarchical cluster analysis of PDAC and adjacent normal tissues was performed to assess the significant expression of lncRNAs (A) and mRNAs (B). The Box Plot shows the distributions of the intensities from the cancerous and adjacent tissues in lncRNAs (C) and mRNAs (D). After normalization, the distributions of log2-ratios among all specimens were nearly the same. The Scatter-Plot shows differences in the expression of lncRNAs (E) and mRNAs (F) between the PDAC and adjacent normal tissues. The green lines are fold-change lines (The default fold-change value given is 2.0). The lncRNAs and mRNAs above the top green line and below the bottom green line indicate more than 2.0 fold change of lncRNAs and mRNAs between the PDAC and adjacent normal tissues. The volcano plot illustrates the distribution of the data in the lncRNA profile (G). The green line in the volcano plot shows the significant fold-hange in lncRNAs.


