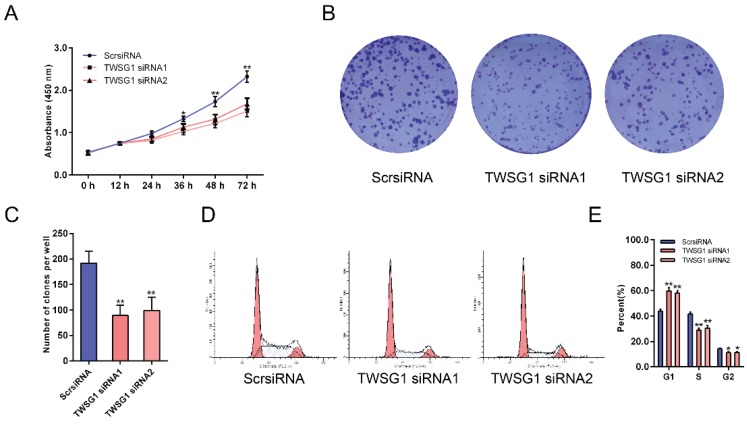
Figure 7.
TWSG1 knockdown inhibits the proliferation of K1 cells. (A) CCK-8 assays were performed to measure K1 cell proliferation 12 h, 24 h, 36 h, 48 h and 72 h after transfection with TWSG1-specific siRNA. (B) Colony formation assays were performed to assess the proliferation of K1 cells transfected with TWSG1-specific siRNA. The colonies were identified and counted. (C) The colony formation assay results are presented as histograms. Data were from independent experiments performed in triplicate and are presented as the mean ± S.D. (D) Flow cytometry images of the cell cycle in K1 cells. (E) Cell cycle quantification is shown as a percentage of total cells. Data are expressed as the mean ± S.D. of three independent experiments. All data are expressed as the mean ± S.D. of three independent experiments. * indicates P<0.05, ** indicates P<0.01.

