Figure 3.
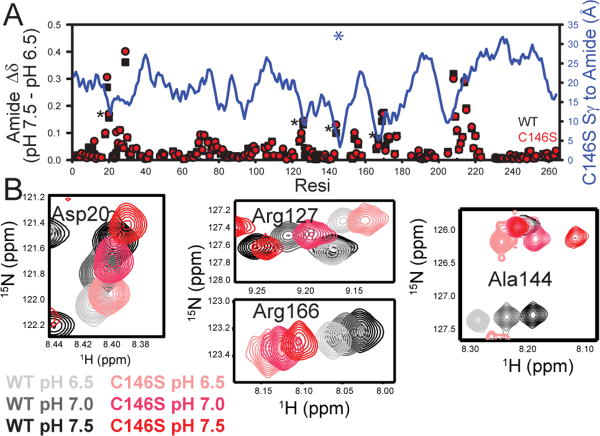
pH dependence of free wild-type and C146S TSase amide chemical shifts. (A) Difference in apo enzyme chemical shift at two pH values (pH 7.5 vs. 6.5) for the wild-type and C146S apo enzymes in black and red respectively. The blue line plot with the right-hand y-axis shows the amide distance to the site of the mutation and the blue asterisk marks the spot of the C146S mutation. (B) Spectra for residues that have pH dependent behavior and are closest to the mutation site. Wild-type titration series is in gray to black and mutant in pink to red. These residues are marked with asterisks in Panel A.

