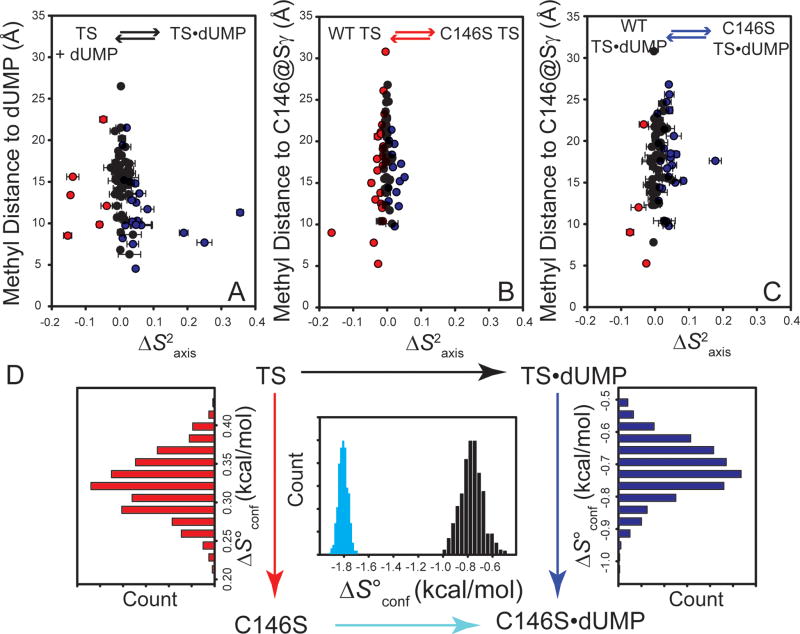
Figure 5.
Change in methyl S2axis and conformational entropy for wild-type and C146S dUMP binding. (A) ILV methyl ΔS2axis for wild-type dUMP binding plotted as a function of distance from a pseudo atom placed at the average methyl proton position, and the nearest dUMP atom. Methyl groups becoming significantly more rigid upon binding are blue, methyl groups becoming significantly more flexible are red, and methyl groups with no significant change are black. Significance criterion is ΔS2axis must be greater than 2σ. ΔS2axis associated with the wild-type to C146S mutation in the free and dUMP-bound states are shown in Panels B and C, respectively. (D) The conformational entropy meter (Experimental Procedures) was used to convert ΔS2axis to ΔS°conf for the different legs of the thermodynamic cycle. The entropy meter shows that ΔS°conf for mutant binding is ∼ 1 kcal/mol (298 K) less favorable than for the wild-type. The histograms for the vertical legs show this difference originates both from increased dynamics in the free state and decreased dynamics in the bound state. Histograms take into account noise in the S2axis measurements (See Experimental Procedures).

