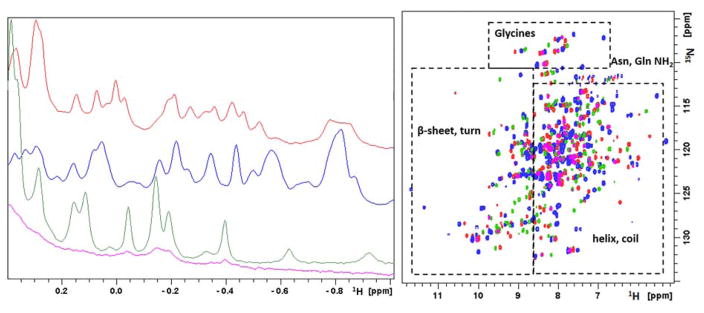
Figure 10. Solution NMR data of Mn2+, Fe2+, Co2+ and Ni2+-bound HsARD isozymes.
Left: Upfield region of 800 MHz 1H NMR spectra of Mn-HsARD (pink), Fe-HsARD (red), Co-HsARD (blue), and Ni-HsARD (green) showing methyl resonances of amino acid side chains ring current-shifted by nearby aromatic residues. The different spectral patterns indicate differences in side chain packing in hydrophobic cores. Right: Overlay of the 2D 1H, 15N HSQC spectra of Mn-HsARD (pink), Co-HsARD (blue), Fe-HsARD (red) and Ni-HsARD (green). Different shift patterns indicate differences in local hydrogen bonding and structure. All spectra were obtained at 25 °C, pH 7.0 at 800 MHz 1H observe frequency. Reproduced with permission from Ref. 4. Copyright 2017 Oxford University Press.

