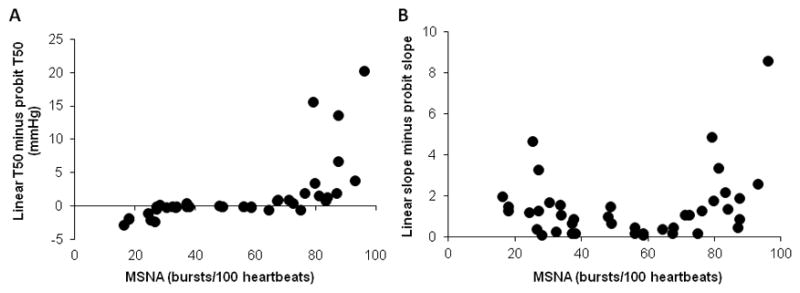
Figure 7.

Difference between T50-values calculated with linear and probit methodology in subjects with different levels of resting muscle sympathetic nerve activity (MSNA) (A). For three subjects with burst incidences >80 the difference was >25 and therefore data points are not shown. Difference between slopes of threshold diagrams calculated with linear and probit methodology in subjects with different levels of resting MSNA (B).
