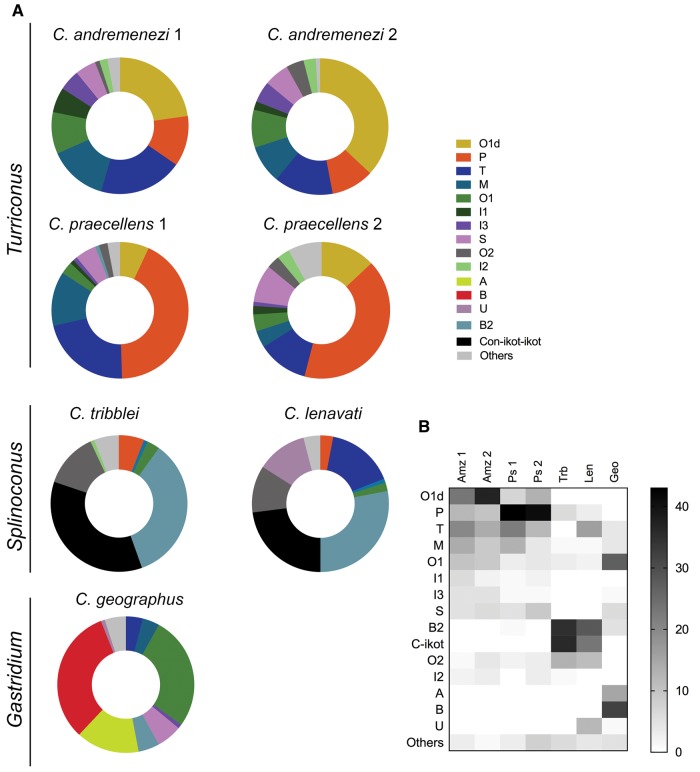
Fig. 3.
—Comparison of relative toxin gene superfamily expression in C. andremenezi and C. praecellens with two members of the Splinoconus clades (C. tribblei and C. lenavati) and one member of the Gastridium clade (C. geographus). (A) Donut charts of expression levels. (B) Heat map showing a select number of superfamilies, including all that were highly expressed in the five species compared here. Plotted numbers represented normalized superfamily read counts. Amz1, C. andremenezi specimen 1; Amz2, C. andremenezi specimen 2; Ps1, C. praecellens specimen 1; Ps2, C. praecellens specimen 2; Trb, C. tribblei (pooled data from three individuals); Len, C. lenavati (pooled data from three individuals); Geo, C. geographus.

