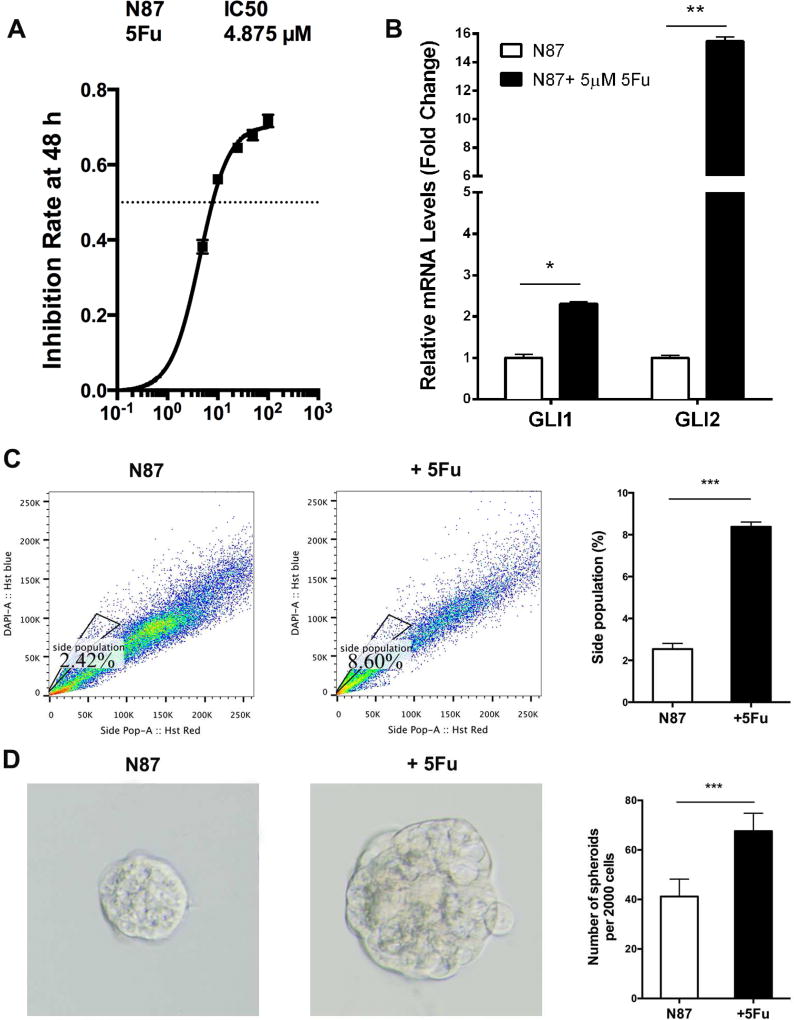
Fig. 1. Intrinsic response of gastric cancer cells to 5Fu.
A: The IC50 dose of 5Fu was calculated from measurement of the inhibition of cell viability by different concentrations of 5Fu (48 h). The X-axis indicates 5Fu concentration (µM), and the Y-axis indicates the reduction of cell viability. B: qPCR analysis of GLI1 and GLI2 in N87 cells with or without 5Fu (5 µM) treatment. C: Side population detected by flow cytometry after staining with Hoechst 33342. The average value from three independent experiments on side population was shown on the right. D: The average diameter of tumor spheres was measured from over 50 tumor spheres, and the typical morphology was shown on the left. Significant difference was indicated by * (P < 0.05), ** (P < 0.005), or *** (P < 0.0005).

