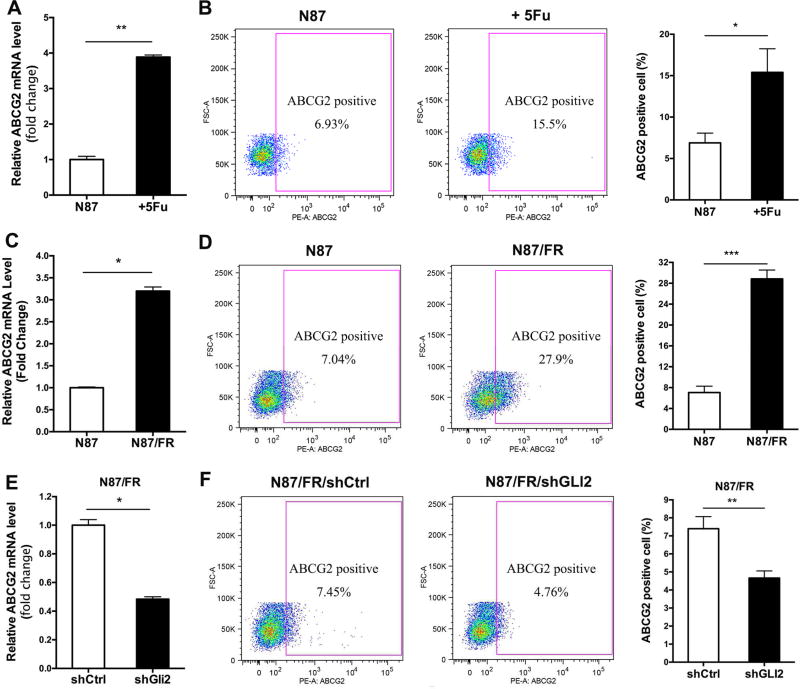
Fig. 4. The effect of shGLI2 and 5Fu on ABCG2 expression.
A: qPCR analysis of ABCG2 after 5Fu treatment in N87 cells. B: Flow cytometry analysis of surface ABCG2 protein expression. The average positivity from there independent experiments was shown on the right. C and D: Comparison of 5Fu resistant N87/FR cells with the parental N87 cells on ABCG2 expression (transcript level shown on the left; and cell surface expression shown on the right). E and F: The effect of GLI2 knockdown on ABCG2 transcript (left) and on cell surface expression (right). Significant difference was indicated by * (P < 0.05), ** ( P < 0.005), or *** (P < 0.0005).

