Fig. 4.

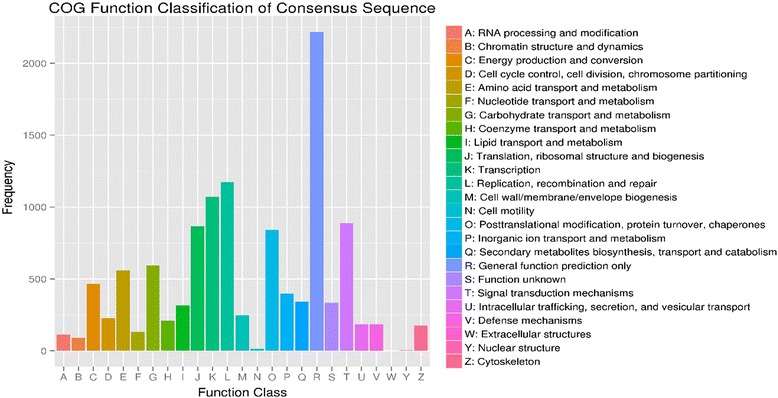
COG annotation of the total assembled unigenes. The left side and the right side of the graph show the frequency number and the classified COG categories, respectively

COG annotation of the total assembled unigenes. The left side and the right side of the graph show the frequency number and the classified COG categories, respectively