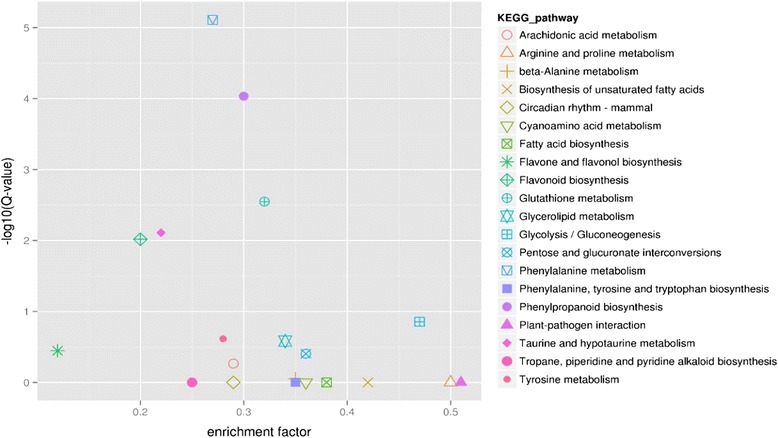
Fig. 5.

The KEGG pathway enrichment scatter diagram of the differential expression genes between T1 stage and T2 stage. The X-axis shows the different enrichment factor of different pathways, and the enrichment factor stand for the ratio between the proportion of DEGs in one pathway and the proportion of all the annotated unigene in the same pathway, the Y-axis shows the different value of “–log10 (Q-value)”, the Q-value stands for P-value after multiple hypothesis testing. The most significant enrichment of twenty pathways was shown in different color and shape in the left of the picture
