
Graph 1.
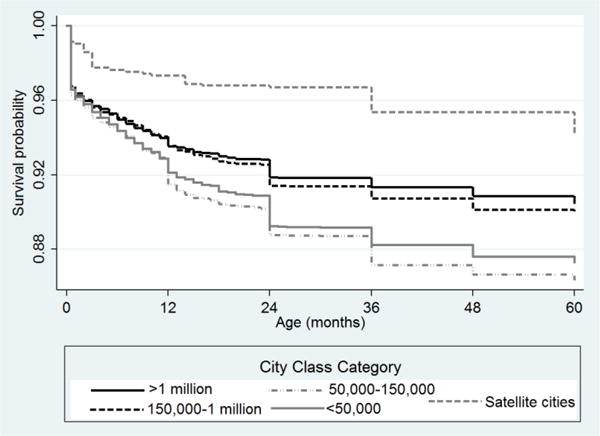
Kaplan-Meier survival curves to age 5 by city class category
Source: Demographic and Health Surveys for Benin, Burkina Faso, Côte d’Ivoire, Ghana, Guinea, Mali, Niger and Senegal.
Official websites use .gov
A
.gov website belongs to an official
government organization in the United States.
Secure .gov websites use HTTPS
A lock (
) or https:// means you've safely
connected to the .gov website. Share sensitive
information only on official, secure websites.
Kaplan-Meier survival curves to age 5 by city class category
Source: Demographic and Health Surveys for Benin, Burkina Faso, Côte d’Ivoire, Ghana, Guinea, Mali, Niger and Senegal.