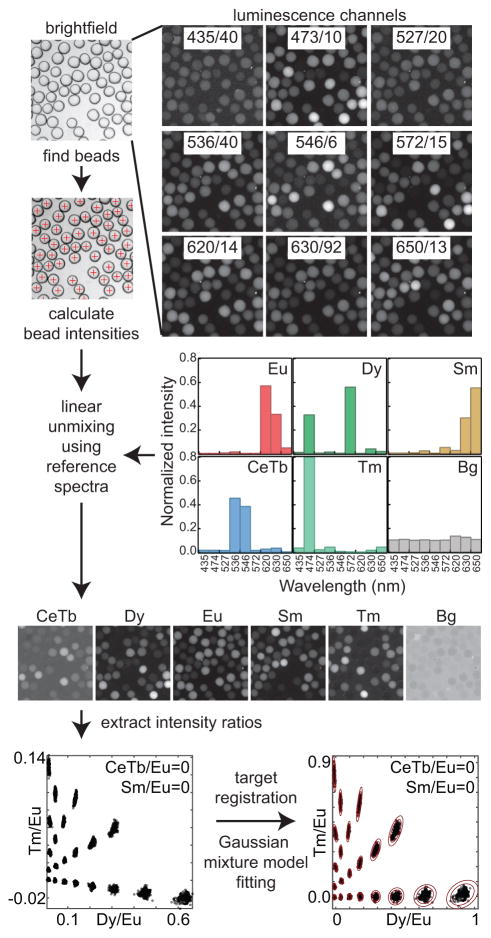
Figure 2.
Image analysis workflow. (A) Brightfield and luminescence images of MRBLEs are recorded with the indicated filters; beads are identified from the brightfield image using the circular Hough transformation. (B) Measured luminescence images are transformed into LN intensity images by linear unmixing using spectra acquired from reference MRBLEs containing a single LN species. For each bead, the median intensity and median intensity ratio are recorded. (C) A transformation matrix registers measured ratios to programmed ratios and a Gaussian mixture model is used to assign individual beads to a particular code. Red ellipses are the 3 and 4 standard deviation contours derived from the Gaussian mixture model covariance matrix.

