Fig. 2.

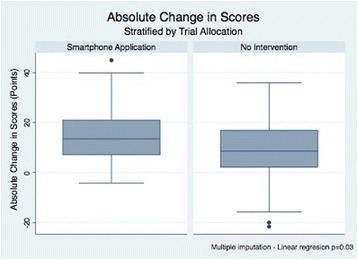
Absolute change in scores between study groups. These boxplots compare the observed differences in perfomance in two simulation tests aimed to resemble EUNACOM

Absolute change in scores between study groups. These boxplots compare the observed differences in perfomance in two simulation tests aimed to resemble EUNACOM