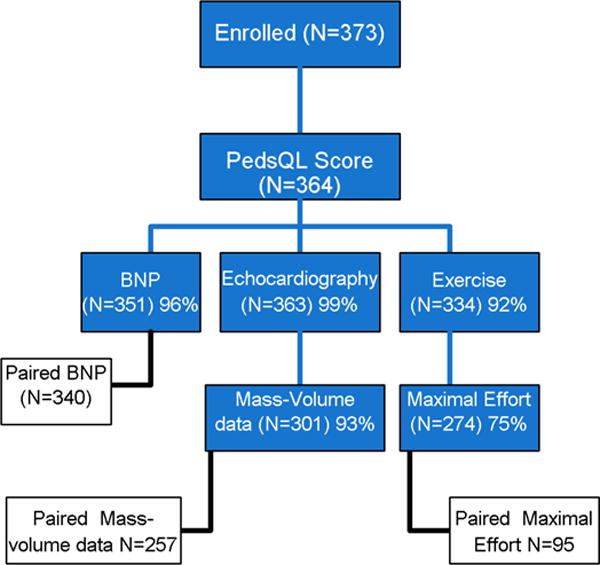
Figure 1. Laboratory testing of subjects enrolled in the Fontan 3 Study.

Number of tests performed by enrolled subjects at Fontan 3 is shown in blue. Number of subjects with paired tests performed at both Fontan 1 and Fontan 3 are shown in white.

Number of tests performed by enrolled subjects at Fontan 3 is shown in blue. Number of subjects with paired tests performed at both Fontan 1 and Fontan 3 are shown in white.