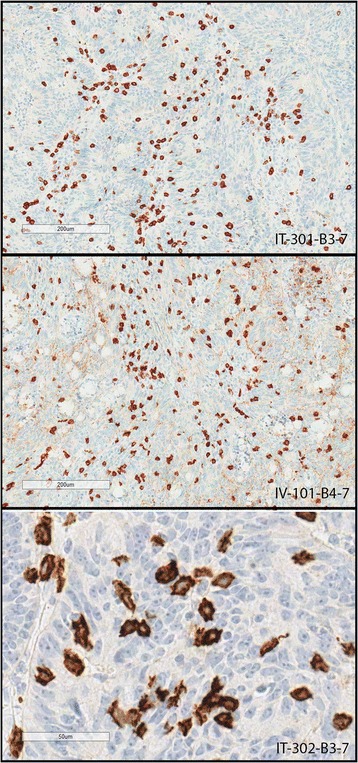
Fig. 3.

CD8 staining in samples from CRC patients (IT injection versus IV infusion). 1. Image IT-301-B3-7 (top panel), tumor section from a patient with CRC treated with enadenotucirev given by IT injection (cohort A): brown CD8 staining (× 10 magnification) can be clearly seen infiltrating the tumor cells. 2. Image IV-101-B4-7 (middle panel), tumor section from a patient with CRC treated with enadenotucirev given by IV infusion (cohort B): brown CD8 staining (× 10 magnification) infiltrating the tumor cells can be clearly seen. 3. Image IT-302-B3-7 (bottom panel), tumor section from a patient with CRC treated with enadenotucirev given by IT injection (cohort A): higher magnification (× 40) showing closer detail of CD8-stained cells, which appear pleomorphic, a hallmark of activated CD8+ T cells
