
Fig. 2.
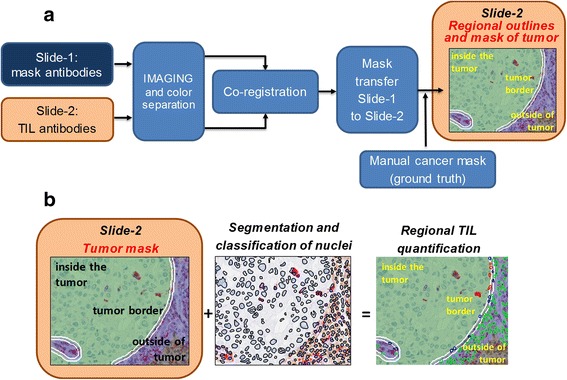
Image analysis workflow. (a) Workflow for regional separation. Corresponding ROIs within areas of invasive breast cancer in slide-1 and slide-2 are imaged and the colors are separated. The Pan-CK image is used to identify the cancer region in slide-1. Thereafter, cancer regions in slide-1 and slide-2 are co-registered based on the best overlap of the hematoxylin-stained nuclei. The mask is then transferred from slide-1 to slide-2. Alternatively, the cancer area in slide-2 is directly delineated by hand to generate the ground truth. (b) Workflow for TIL quantification. Nuclei are segmented in the whole image. Next, TILs are identified based on the color in the cytoplasm and counted within the tumor, at the tumor border and outside the tumor