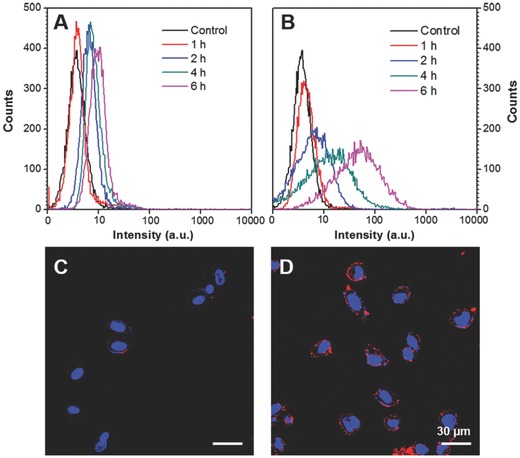
Figure 3.

Flow cytometry histograms of MDA‐MB‐231 cells after incubation with A) CPN6 and B) CPN30 for different time. Confocal images of MDA‐MB‐231 cells after 6 h incubation with C) CPN6 and D) CPN30 at the same PFBTDBT concentration (0.01 mg mL−1). Red channel: E x = 543 nm, E m = above 605 nm; blue channel: E x = 405 nm, E m = 430–470 nm.
