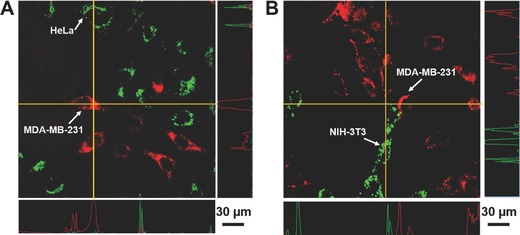
Figure 6.

CLSM images of cRGD‐CPN6 treated A) HeLa and MDA‐MB‐231 cell mixture and B) NIH‐3T3 and MDA‐MB‐231 cell mixture. HeLa and NIH‐3T3 cells were pretreated with CellTracker 540 to be green emissive (2 × 10⁻⁹ m, 2 h) before mixing with the same amount of MDA‐MB‐231 cells. Green channel: E x = 488 nm, E m = 505–525 nm; red channel: E x = 543 nm, E m = above 605 nm.
