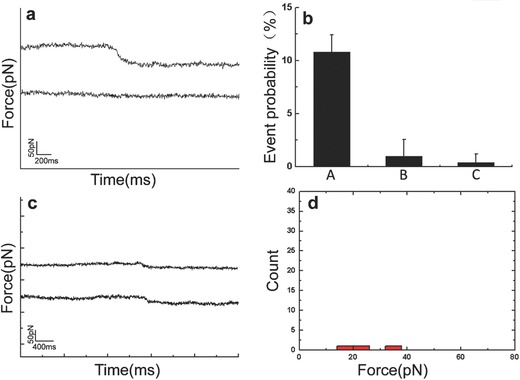
Figure 3.

Control experiments. a) Typical force tracing curves (upper) of virus entry. No signals (lower) were observed when blocked with cytochalasin B. b) The probability of tracing curves with force signal under different conditions, including (A) (functionalized tip on cell surface without blocking), (B) (functionalized tip on cell surface after blocking with CB), (C) (clean tip without being modified with viruses on cell surface). Values are represented by mean ± standard deviation. c) Force tracing curves observed from 1000 curves with force signals was about 0.3% and the force value of about 20 pN. d) The force distribution of force tracing curves in the control experiment (n = 3 that were chosen from 1000 force tracing curves).
