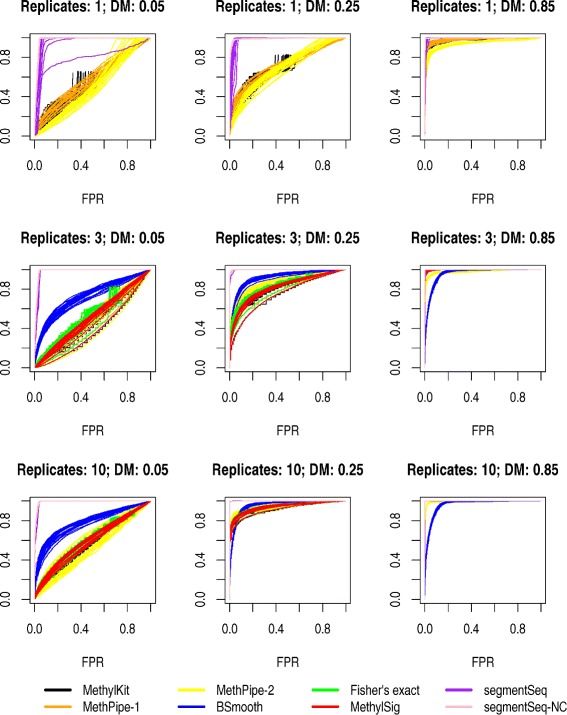
Fig. 5.

ROC curves from simulated data based on WGBSSuite analyses of CpG methylation in Arabidopsis. Analyses for 1, 3 and 10 replicates are shown, and for small (0.05), moderate (0.25) and large (0.85) changes in methylation in the differentially methylated regions. Twenty simulations were carried out for each choice of replicate number/difference in methylation and curves for each simulation are shown here
