
Fig. 4.
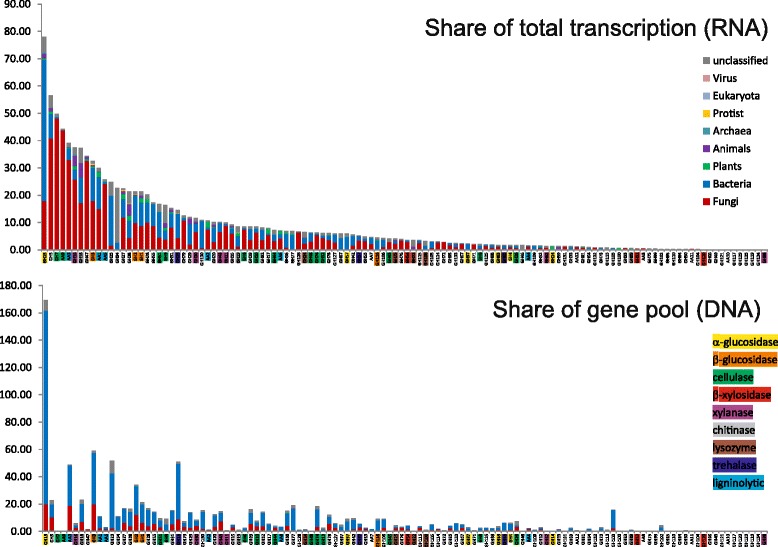
Share of AA and GH families with abundance over five unit of ppm on total transcription and gene pool in the P. abies topsoil. Read abundances are in ppm (reads per one million reads). Colors of stack bars indicate taxonomic affiliation of transcripts and genes, functional groups of CAZymes are color-coded in name of the CAZy family