
Fig. 1.
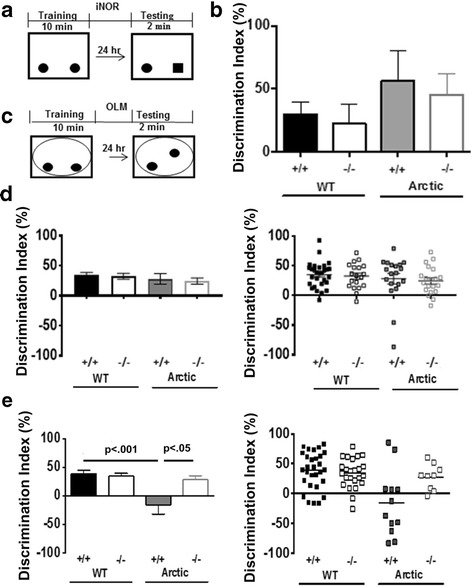
Performance in Novel Object and Object Location Memory Tasks. Animals were tested in novel object recognition test (a,b) and novel object location memory test (c-e) after 5 days of handling and 4 days of habituation to the testing chamber. Paradigm schematics are presented for iNOR (a) and OLM (c). Solid oblongs or circles in the boxes represent identitcal objects. After Day 1 training, one familiar object was replaced with a novel object (solid square) (a) or a familiar object was moved to the center of the context (c). The novel object replacement or the object moved was counter balanced among all trials. Performance was evaluated using the first two minutes of testing at 9 months for iNOR (b), and either 7 months (d) or 10 months (e) for OLM. (b) WT n = 11, C5aR1KO n = 6, Arctic n = 4, Arctic/C5aR1KO n = 5. Right plots in d and e are the scatter plots for left bar graphs, respectively. (d) n = 29 (WT), 19 (C5aR1KO), 19 (Arctic) and 20 (Arctic/C5aR1KO). (e) n = 29 (WT), 25 (C5aR1KO), 12 (Arctic) and 9 (Arctic/C5aR1KO). (b,d,e) Data is expressed as the average +/− SEM. P values were determined by ANOVA followed by Tukey’s post hoc test