
Fig. 6.
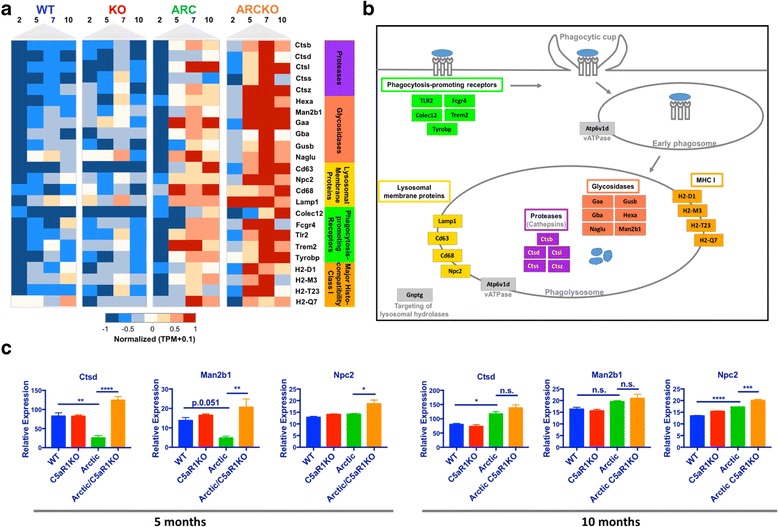
Gene expression profiles of selected genes in lysosome and phagosome pathways. All genes in heat map were present in cluster 2. All but Trem2 and Tyrobp were also found in the phagosome or lysosome KEGG pathways. Trem2 and Tyrobp were added due to known roles in microglial phagocytosis. (a) Selected genes were clustered based on molecule functions: protease (purple), glycosidases (coral), lysosomal membrane proteins (yellow), phagocytosis-promoting receptors (green) and major histocompatibility class I (orange). Quantile normalized TPM plus 0.1 were transformed between −1 and 1 to present high (red) and low (blue) expression level during time-course across four genotypes for each gene. (b) Schematic of the phagolysosome pathway with genes present in heat map colored accordingly. (c). RT-PCR analysis on a subset of genes to validate the RNA-seq dataset, as described in Fig. 5 legend. Bars represent group mean expression +/− SEM (n = 3). P value was calculated using one way ANOVA followed by Sidak’s multiple comparison test