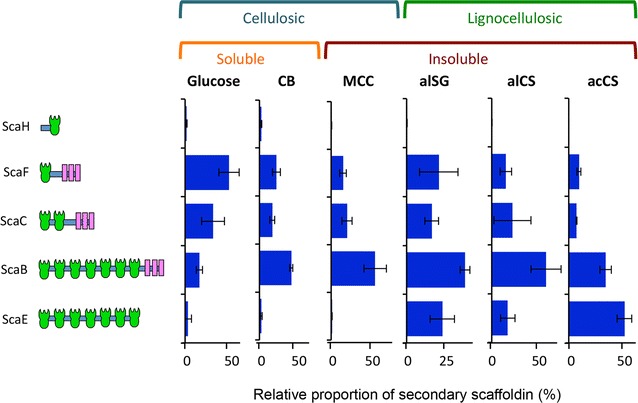
Fig. 3.

Differential distribution of secondary type II cohesin-containing scaffoldins. iBAQ intensities of all secondary scaffoldins in each sample were summed up, and the relative proportions of each secondary scaffoldin in each sample was calculated. The carbon source (see legend to Fig. 1 for definitions) used for the respective cellulosome production is shown in the graph
