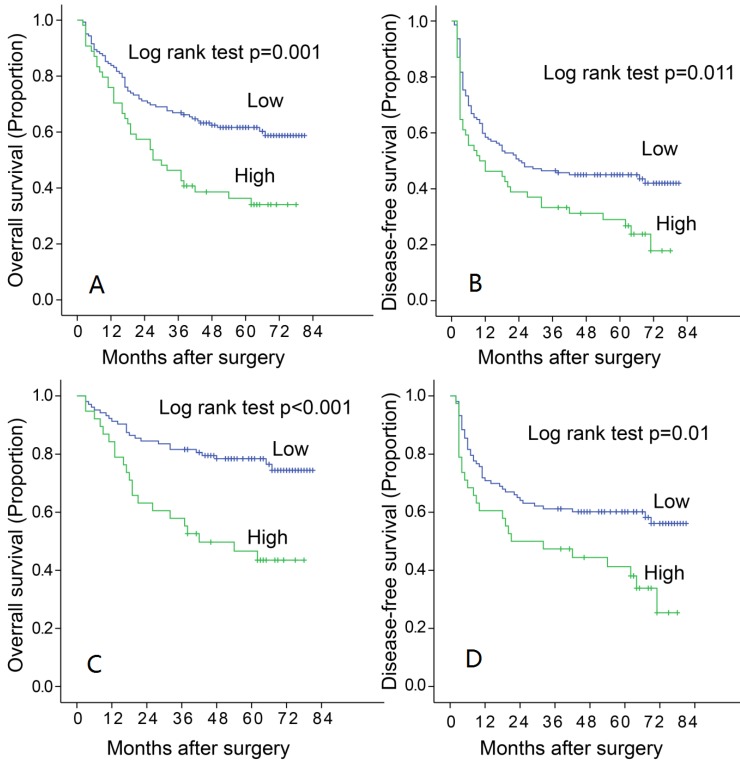
Figure 2.
Increased LAMC 1 expression is correlated with poor prognosis of HCC. A. LAMC 1 expression was associated with OS according to Kaplan-Meier analysis. (n=196, p=0.001). B. LAMC 1 expression was associated with DFS according to Kaplan-Meier analysis. (n=196, p=0.011). C. Subgroup analysis for OS based on TNM staging I-II (n=141 P<0.001). D. Subgroup analysis for DFS based on TNM staging I-II (n=141, P=0.001).

