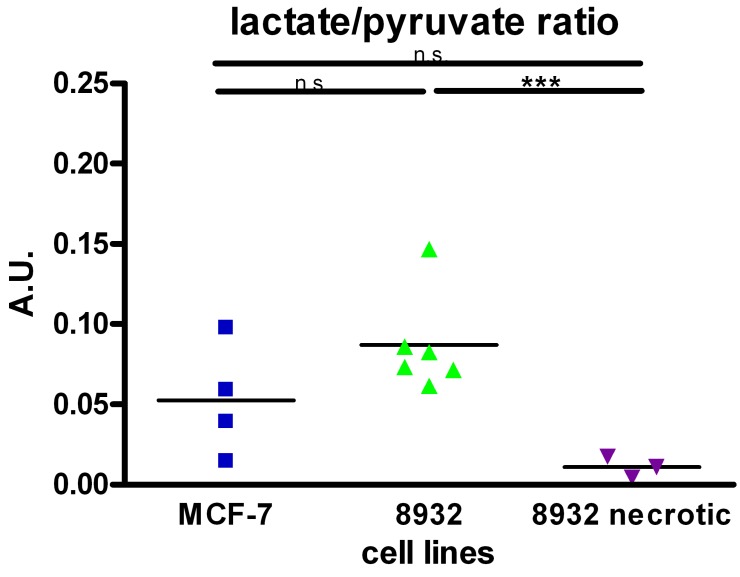
Figure 2.
Pyruvate to lactate ratio in MCF-7, 8932 and necrotic cell lines as assessed by the specific spectra. The lactate to pyruvate ratio was higher in 8932 cells compared with MCF-7 and 8932 necrotic cells. Data are shown as single point observations, the bar represents the mean of the respective values. *** indicates a p < 0.001; n.s. = non significant difference as assessed by an ANOVA analysis.

