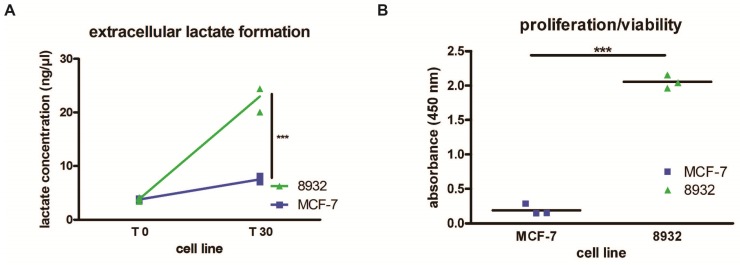
Figure 3.
(A) 8932 pancreatic cancer cells show more lactate concentration in the medium thus displaying higher metabolic turnover compared to MCF-7 cells after addition of a 100 mM pyruvate solution and sample collection after 30 seconds (T30) (p < 0.0001; n = 3). T 0 displays lactate concentration in a steady-state prior to addition of pyruvate. (B) Absorbance measurements using a WST-1 proliferation/viability assay displaying higher proliferation/viability after 24 h in 8932 cells compared to MCF-7 cells (p < 0.0001; n = 3). The bar represents the mean.

