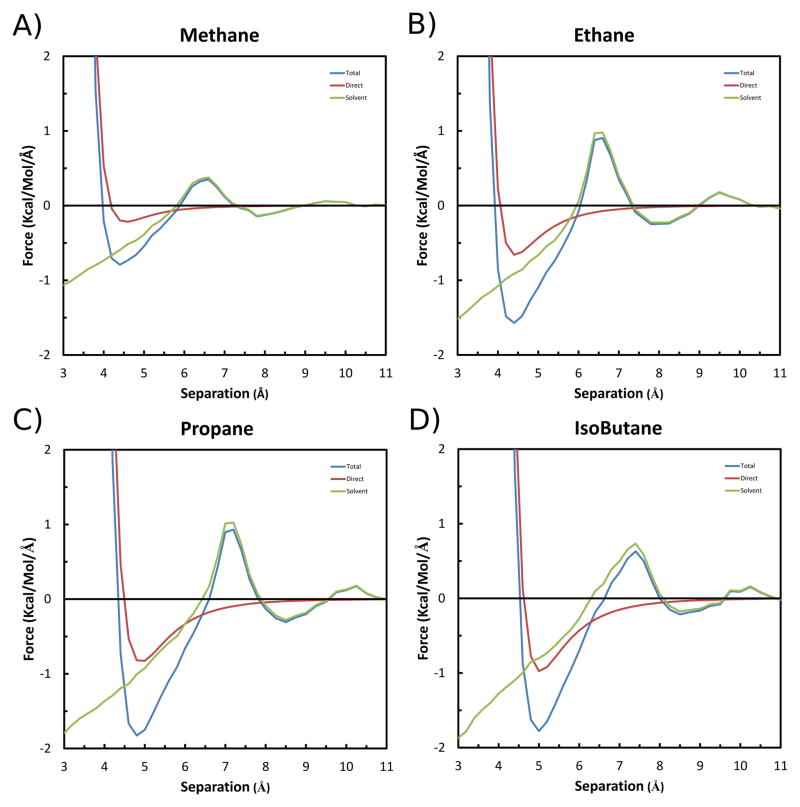
Figure 5.
Forces along the X-axis experienced by each solute in the A) Methane, B) Ethane, C) Propane and D) Isobutane pairs as a function of separation. The Total is shown in blue, the Solvent-Induced component in green, and the Direct component in red. Negative magnitude indicates an attraction, and positive indicates repulsion.

