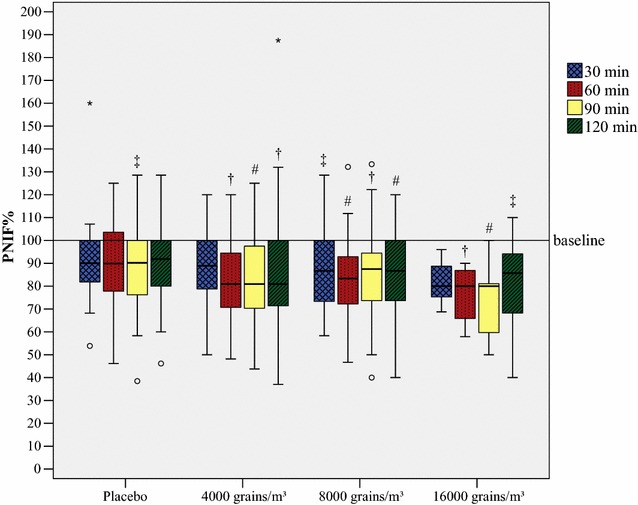
Fig. 2.

Reduction of PNIF during exposure with birch pollen in the GA2LEN chamber. PNIF development during exposure with Betula pendula. A hash marks a reduction compared to baseline p < 0.001, a dagger a reduction compared to baseline p < 0.01 and a double dagger a reduction compared to baseline p < 0.05. Outliers are presented as degree sign, extreme outliers as asterisk. PNIF% is displayed as medians and boxplots
