Fig. 4.

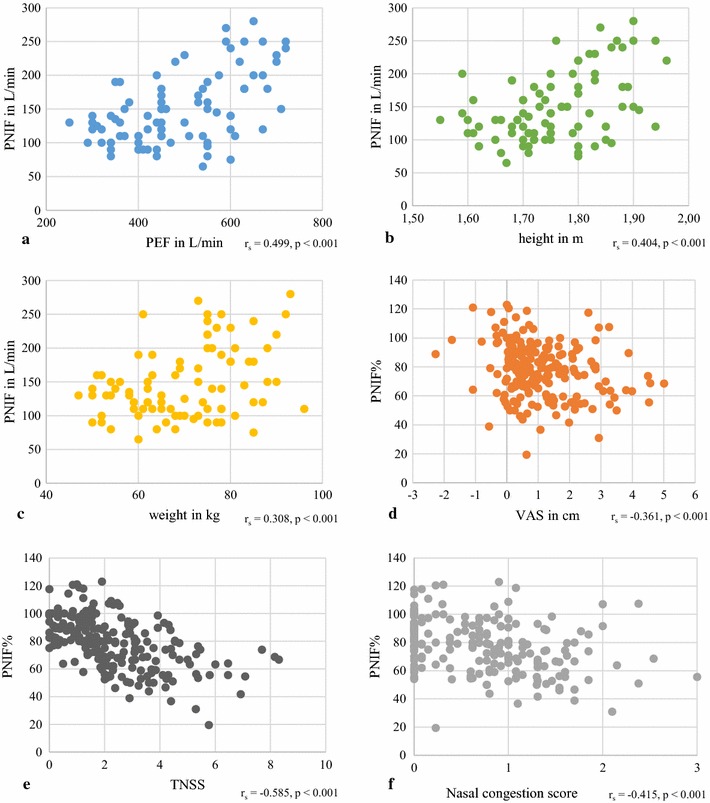
Correlations between peak nasal inspiratory flow (PNIF) and oral peak expiratory flow (PEF) (a), height (b), and weight (c) with n = 86, and relative peak nasal inspiratory flow compared to baseline (PNIF%) and mean VAS change from baseline (d), mean Total Nasal Symptom Score (TNSS) (e), and mean nasal congestion score (f) with n = 203
