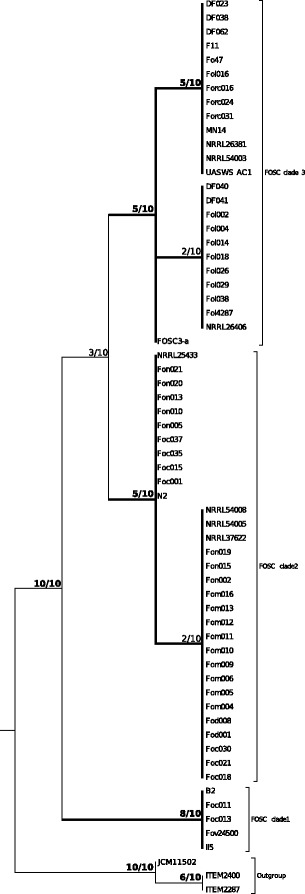
Fig. 2.

Genealogical concordance phylogenetic species recognition based on the 10 loci data set. The 10 loci used in the analysis were: act, tub2, cal, tef1a, tef3, rpl10a, rpb2, top1, rDNA repeat and the conserved part of the mitogenome. Only clades that were highly supported (BPP ) in at least two single locus phylogenies were included in the analysis. The three clades within the FOSC were recognized as phylogenetic species and shown in the tree. The support values indicate how many single locus phylogenies supported the given clade with BPP out of the 10 loci
