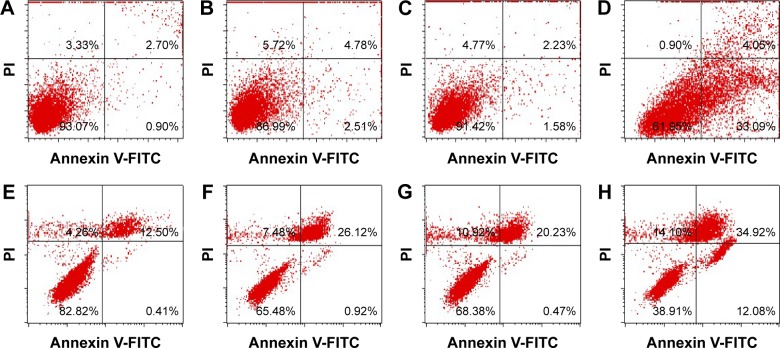
Figure 10.
Measurement of apoptotic population induced by the extract, GM-AuNPs, and GM-AgNPs on A549 cells (A–D) and NIH3T3 cells (E–H).
Notes: A549 cells were treated with (A) vehicles, (B) the extract, (C) GM-AuNPs, and (D) GM-AgNPs. NIH3T3 cells were treated with (E) vehicles, (F) the extract, (G) GM-AuNPs, and (H) GM-AgNPs. The cells were treated with three samples (ie, extract, GM-AuNPs, and GM-AgNPs) the concentrations of which were 37.5 μg/mL (based on the extract concentration). The lower left quadrant, lower right quadrant, and upper right quadrant represent living cells, early apoptosis, and late apoptosis (and dead cells), respectively.
Abbreviations: FITC, fluorescein isothiocyanate; GM-AgNPs, silver nanoparticles green synthesized by mangosteen pericarp extract; GM-AuNPs, gold nanoparticles green synthesized by mangosteen pericarp extract.

