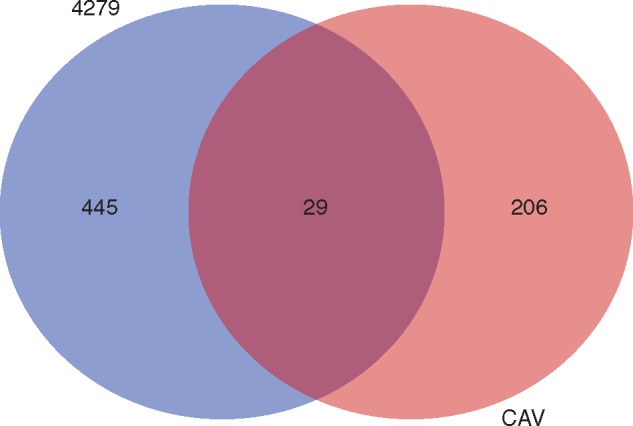
Fig. 3.

Global Venn diagram summarizing numbers of distinct differentially expressed genes (DEGs) observed in Musa acuminata genotypes CAV and 4279-06 following infection by Meloidogyne incognita over a 10 d period. DEGs were considered significant when relative gene expression between inoculated and non-inoculated treatments showed at least a 2-fold FC (log2FC threshold >1·0 or < –1·0), considering a false discovery rate (FDR)-adjusted P-value (padj) of 0·01. The overlapping region of the diagram represents DEGs common to both Musa genotypes during the interaction with M. incognita. Annotation and expression data for all DEGs are listed in Table S1.
