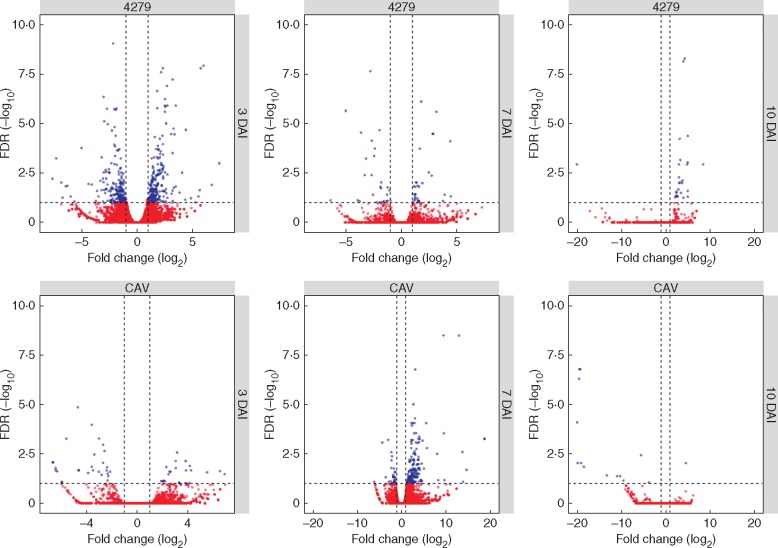
Fig. 5.
Volcano scatter plots for differentially expressed genes (DEGs) in Musa acuminata genotypes CAV and 4279-06 following infection by Meloidogyne incognita over a 10 d period. Genes that were highly modulated following infection, in relation to non-inoculated controls, appear farther to the left and right sides, with highly significant changes appearing higher on the plot. Significant DEGs are represented in blue, with up-regulated genes following infection represented on the right-hand side of each plot and downregulated genes on the left-hand side. Non-significant DEGs are represented in red.

