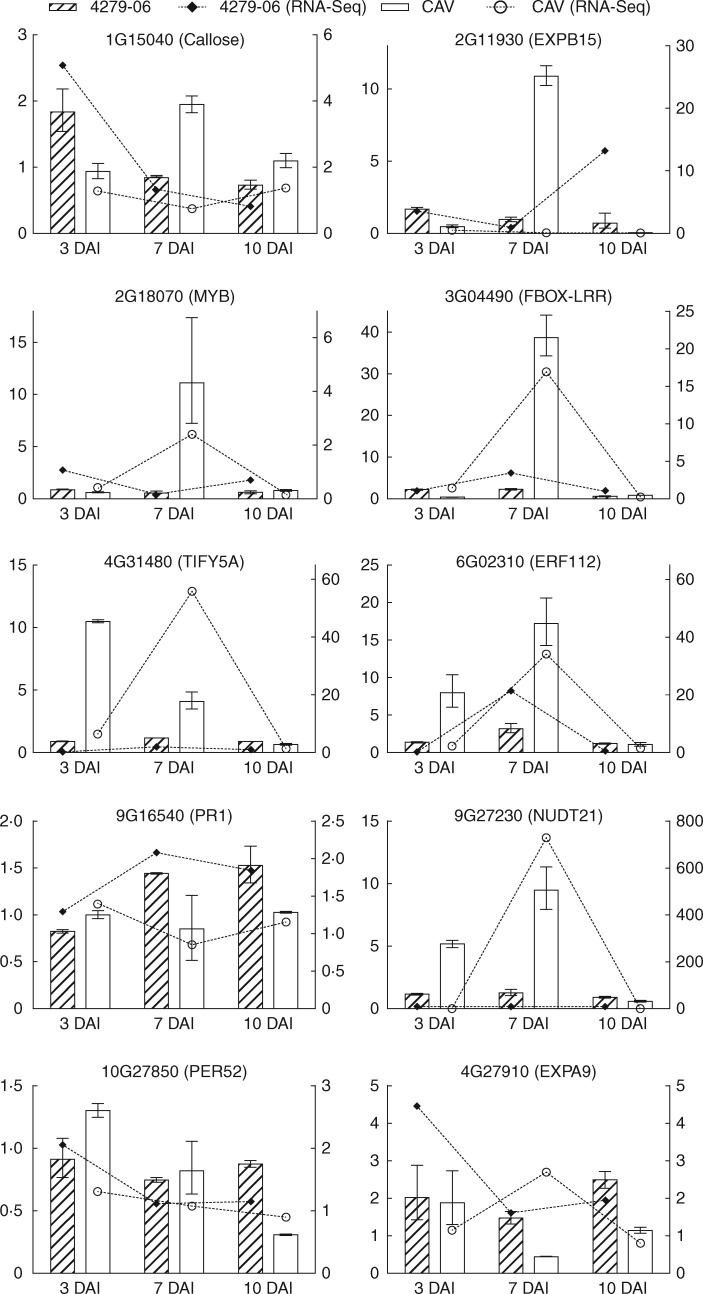
Fig. 6.
Validation of differential expression profiles (log2FC) based on RNA-Seq and qRT-PCR for selected genes in Musa acuminata CAV and 4279-06 in infected vascular root tissues vs. non-infected controls. qRT-PCR data are presented on the left y-axis, with RNA-Seq data on the right y-axis. Bars indicating standard error values are based upon three independent biological replicates per genotype and time point and three technical replicates per amplification.

