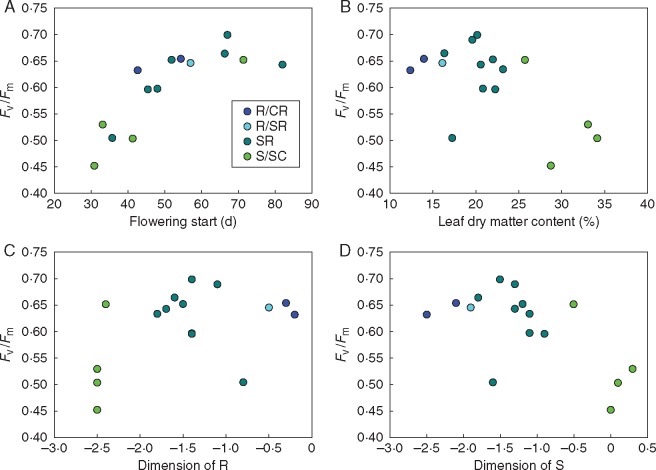
Fig. 4.
Correlation between whole-rosette maximum photosystem II efficiency (Fv/Fm) measured at the start of senescence (day 58) and flowering start under controlled conditions (A), leaf dry matter content (B), the dimension of R (C) and the dimension of S (D). Spearman rank correlation analysis for Fv/Fm vs. flowering start under controlled conditions: r = 0·811, P = 0·000; Fv/Fm vs. leaf dry matter content: r = –0·512, P = 0·043; Fv/Fm vs. dimension of R: r = 0·373, P = 0·155; Fv/Fm vs. dimension of S: r = –0·530, P = 0·035. Pearson correlation analysis for Fv/Fm vs. flowering start under controlled conditions: r = 0·793, P = 0·001; Fv/Fm vs. leaf dry matter content: r = –0·589, P = 0·016. See also Table S4 for correlations.

