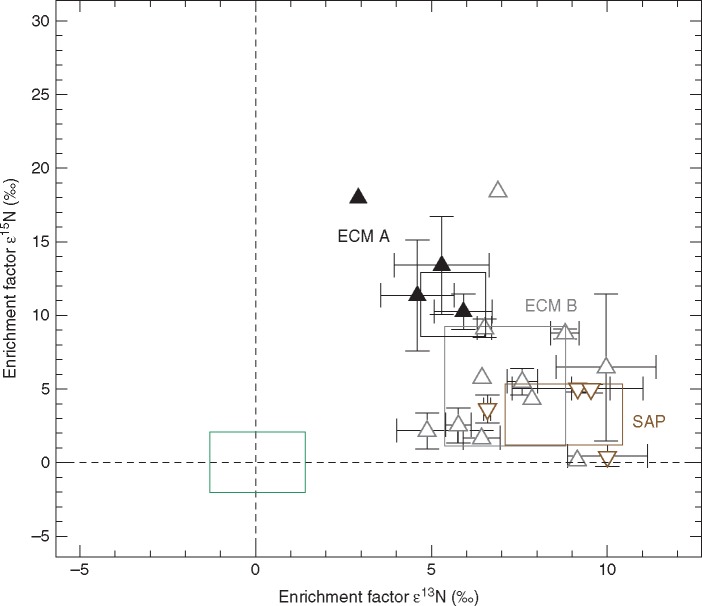
Fig. 3.
Mean enrichment factors ε13C and ε15N ± 1 s.d. as calculated for sporocarps of four ECM ascomycete Tuber species (filled black upward triangles), 11 ECM basidiomycete species (open grey upward triangles) and four saprotrophic basidiomycete species (open brown downward triangles). All open symbols indicate data extracted from Gebauer et al. (2016) (Table S2). The green box represents mean enrichment factors ±1 s.d. for the autotrophic reference plants that were sampled at the same sites as the fungal sporocarps (REF, n = 228, see Tables S1 and S2) whereas mean ε values of reference plants are zero by definition. The black, grey and brown boxes represent mean enrichment factors ±1 s.d. of the ECM ascomycetes (ECM A), ECM basidiomycetes (ECM B) and saprotrophic basidiomycetes (SAP), respectively.

