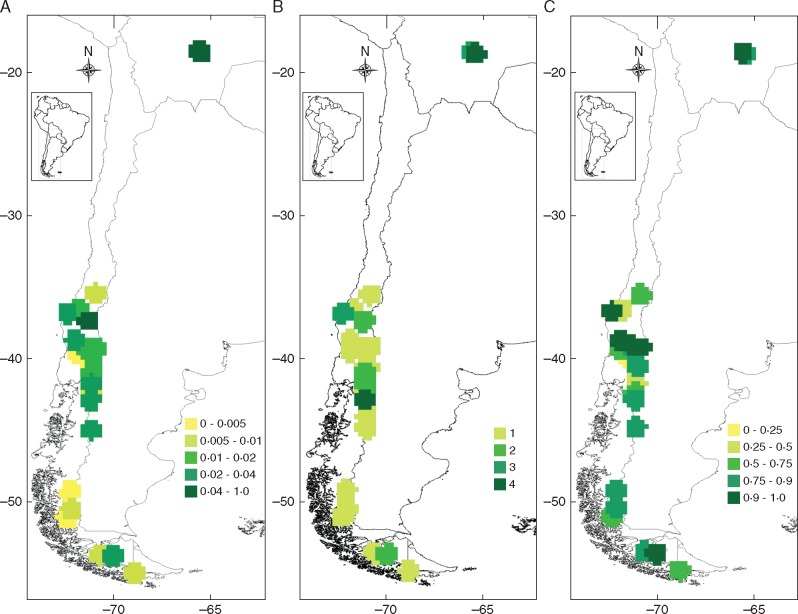
Fig. 2.
Geographical distribution patterns of genetic diversity. (A) nucleotide diversity of all Arachnitis uniflora-associated fungal tax at each site. (B) Number of glomeromycotan clades per site. (C) Haplotype diversity using only those sequences belonging to the Arachnitis clade (Fig. 1). Colour scales indicate genetic diversity values based on a 33·3 × 33·3 km grid cell.

