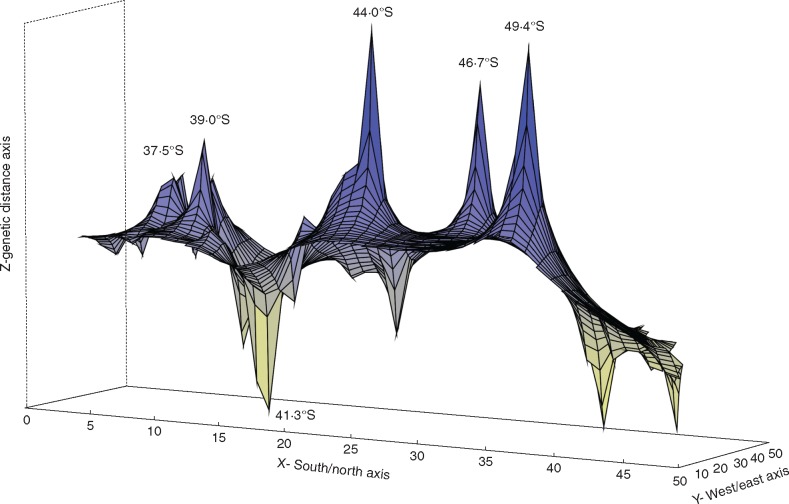
Fig. 5.
Genetic landscape shape interpolation analysis using a 50×50 grid size and a distance weighting parameter of a = 1. The x- and y-axes correspond to geographic locations; the z-axis shows genetic distances. Positive peaks show genetic discontinuities or possible barriers to gene flow, and are referenced with latitude coordinates. The analysis was conducted with fungal sequences belonging to the Arachnitis clade (Fig. 1).

